
Build an Audio Spectrum Analyzer
An audio spectrum analyzer displays the energy contained in different frequency ranges of an audio signal. Unlike a simple VU meter, which shows overall signal level, a spectrum analyzer separates the signal into frequency bands so that bass, midrange and treble activity can be observed independently.
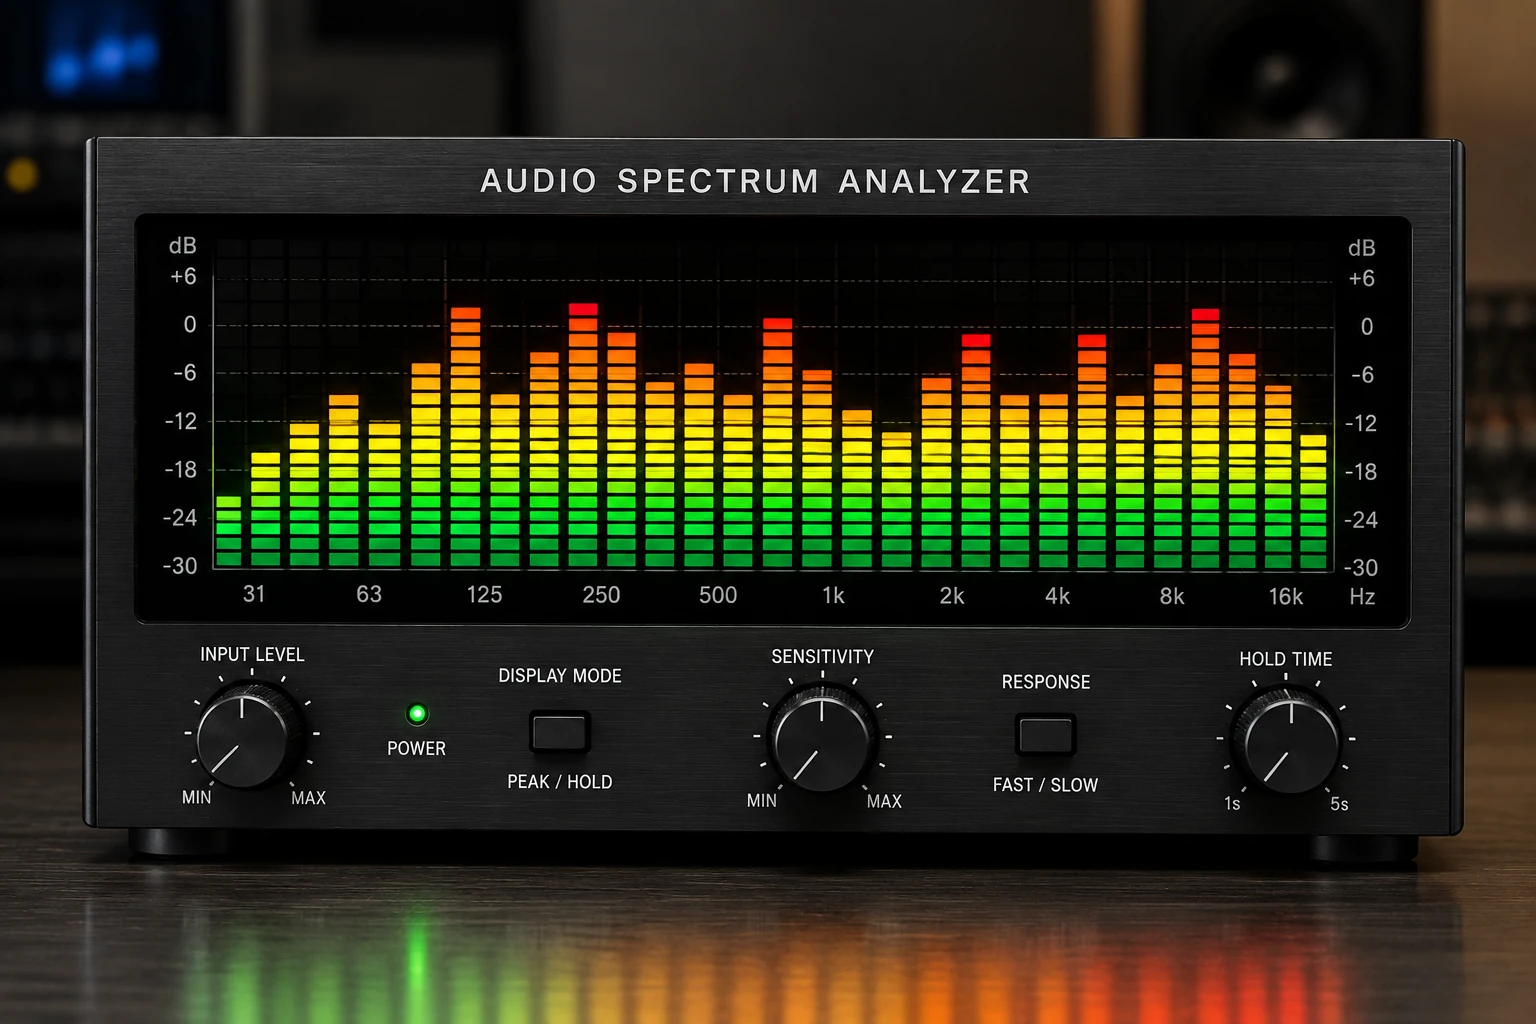
Project Overview
Music contains many frequencies at the same time. A bass drum produces strong low-frequency energy, voices occupy much of the midrange and cymbals contain substantial high-frequency energy.
An audio spectrum analyzer separates these frequency components into individual bands and displays their relative levels.
Audio Signal
     │
     ▼
Input Buffer
     │
     ▼
Frequency Filters
     │
 ┌───┼────┬────┬────┐
 ▼   ▼    ▼    ▼    ▼
Bass  Low  Mid  High  Treble
 │    │    │     │      │
 ▼    ▼    ▼     ▼      ▼
Level Detection
 │    │    │     │      │
 └────┴────┴─────┴──────┘
              │
              ▼
           Display
Spectrum Analyzer vs VU Meter
A VU meter measures the overall level of an audio signal. A spectrum analyzer provides additional information about where the energy is located in the frequency range.
| Feature | VU Meter | Spectrum Analyzer |
|---|---|---|
| Overall signal level | Yes | Yes |
| Frequency separation | No | Yes |
| Bass information | Limited | Yes |
| Midrange information | Limited | Yes |
| Treble information | Limited | Yes |
Audio Frequency Bands
The audible frequency range is commonly divided into several useful regions.
| Region | Approximate Range |
|---|---|
| Sub-bass | 20–60 Hz |
| Bass | 60–250 Hz |
| Low midrange | 250–500 Hz |
| Midrange | 500 Hz–2 kHz |
| Upper midrange | 2–4 kHz |
| Presence | 4–6 kHz |
| Treble | 6–20 kHz |
These ranges are only practical divisions. A real analyzer can use different center frequencies and bandwidths depending on its intended application.
Basic Analog Spectrum Analyzer
A simple analog analyzer can be constructed using several band-pass filters.
                 ┌──► Low Filter ──► Detector ──► Display
                 │
Audio Input ─────┼──► Mid Filter ──► Detector ──► Display
                 │
                 ├──► High Filter ─► Detector ──► Display
                 │
                 └──► Treble Filter ► Detector ─► Display
Each filter passes a selected portion of the audio spectrum.
The output of each filter is then converted into a level that can be displayed.
Band-Pass Filters
The main building block of an analog spectrum analyzer is the band-pass filter.
A band-pass filter allows a selected range of frequencies to pass while attenuating frequencies below and above that range.
Amplitude
   │
   │        /\
   │       /  \
   │      /    \
   │_____/      \_____
   │
   └──────────────────── Frequency
             Center
           Frequency
Each analyzer channel uses a different center frequency.
Choosing the Center Frequencies
A simple analyzer might use only three or four bands.
100 Hz
300 Hz
1 kHz
3 kHz
10 kHz
A more detailed display may use many more bands, for example an octave or one-third-octave arrangement.
More bands provide more frequency information but require additional filters, detectors and display channels in an analog implementation.
Active Filters
Operational amplifiers can be used to build active band-pass filters.
Active filters provide gain as well as frequency selection and can avoid the need for inductors in many audio applications.
Common op-amps used in audio circuits include devices such as the NE5532 and other suitable low-noise operational amplifiers.
Envelope Detection
The filtered audio signal is an AC waveform. A display circuit usually needs a DC voltage representing its amplitude.
An envelope detector or rectifier can perform this conversion.
Filtered Audio
      │
      ▼
Rectifier
      │
      ▼
Smoothing
      │
      ▼
DC Level
      │
      ▼
Display
The smoothing time constant affects how quickly the display responds and falls back toward zero.
Peak Detection
A peak detector can capture short signal peaks and hold them for a short period.
This can make a visual analyzer easier to read because brief peaks do not disappear immediately.
The hold time should be selected according to the desired visual response.
LED Bar Display
Each frequency channel can drive an LED bar graph.
10 kHz  ████████
 5 kHz  ██████
 2 kHz  █████
 1 kHz  ███████
500 Hz  █████████
200 Hz  ████
100 Hz  █████
The height of each bar represents the relative level of that frequency band.
LED driver ICs can simplify the display circuitry.
Using an LED Driver IC
A bar-graph driver can convert an analog level into a series of illuminated LEDs.
For example, an LM3914-style display driver can represent an analog voltage using multiple LED levels.
Different driver arrangements can be used depending on whether the display should operate in dot mode, bar mode or another visual format.
Digital Spectrum Analyzer
A digital analyzer can perform the frequency analysis using sampled audio data.
Audio Input
     │
     ▼
ADC
     │
     ▼
Digital Samples
     │
     ▼
FFT
     │
     ▼
Frequency Bins
     │
     ▼
Display
This approach can provide many frequency bands without requiring a separate analog filter for every band.
FFT Analysis
The Fast Fourier Transform (FFT) is a mathematical method for efficiently calculating the frequency components of a sampled signal.
The input waveform is converted from the time domain into a frequency representation.
Time Domain
     │
     ▼
Audio Samples
     │
     ▼
FFT
     │
     ▼
Frequency Domain
The resulting frequency bins can then be mapped to bars on a graphical display.
Sampling Rate
A digital analyzer must sample the audio signal at a sufficiently high rate.
According to the Nyquist principle, the sampling rate must be greater than twice the highest frequency that needs to be represented.
For full-band audio, a sampling rate such as 44.1 kHz or 48 kHz is commonly used.
Microcontroller Implementation
A microcontroller with a suitable ADC can be used to build a compact digital spectrum analyzer.
The microcontroller can:
- Sample the audio input.
- Apply a window function.
- Perform an FFT.
- Calculate frequency levels.
- Convert levels into display values.
- Drive an LED or graphical display.
A more powerful microcontroller can provide many frequency bands and smooth animation.
Input Protection
The analyzer input should be protected from excessive voltage.
A line-level audio input is normally much smaller than the output of a power amplifier.
Never connect a speaker-level amplifier output directly to a microcontroller ADC or low-level analyzer input without suitable attenuation and protection.
Input Buffer
A buffer stage provides a suitable impedance between the audio source and the filter network.
Audio Source
     │
     ▼
Input Buffer
     │
     ▼
Filter Bank
The buffer prevents the filters from excessively loading the preceding audio equipment.
Stereo Spectrum Analyzer
A stereo analyzer can process the left and right channels separately.
Left Input
    │
    ▼
Left Filter Bank
    │
    ▼
Left Display


Right Input
    │
    ▼
Right Filter Bank
    │
    ▼
Right Display
A stereo display provides a visual representation of how the frequency content differs between the two channels.
Display Options
Several display technologies can be used.
- LED bar graphs.
- Individual LEDs.
- Seven-segment displays.
- LCD displays.
- OLED displays.
- TFT graphical displays.
- Computer or web-based visualization.
Testing the Analyzer
A function generator is useful for testing an analog spectrum analyzer.
Apply a sine wave at a known frequency and verify that the correct frequency band responds.
For example, apply a 1 kHz tone and confirm that the 1 kHz channel produces the strongest response.
Repeat the test at several frequencies across the analyzer's range.
Testing With Music
After verifying the individual bands with test signals, connect a normal line-level audio source.
Play music containing bass, vocals and high-frequency instruments.
The low-frequency bands should respond strongly to bass content while higher bands respond to cymbals and other high-frequency material.
Troubleshooting
No Display
- Check the power supply.
- Check the audio input.
- Check the display driver.
- Check the detector output.
- Check the filter connections.
All Bands Respond Equally
- Check the filter center frequencies.
- Check whether the filters are actually frequency selective.
- Check component values.
- Check unwanted signal coupling between channels.
One Band Does Not Respond
- Check the corresponding filter.
- Check the detector.
- Check the display driver input.
- Check the filter component values.
Display Is Too Slow
- Reduce the detector smoothing time.
- Reduce the peak-hold time.
- Increase the digital display update rate.
Display Is Too Noisy
- Improve power-supply filtering.
- Reduce input noise.
- Improve grounding.
- Adjust the detector time constant.
- Use appropriate digital averaging.
Common Applications
- Audio equipment.
- Music visualizers.
- DJ systems.
- Recording equipment.
- Amplifier test equipment.
- Audio education.
- Speaker testing.
- Room and sound-system analysis.
Safety Notes
- Use a low-voltage supply for the analyzer.
- Do not connect speaker outputs directly to low-level inputs.
- Use suitable attenuation when measuring high-level signals.
- Disconnect equipment before changing wiring.
- Use appropriate isolation when working with mains-powered audio equipment.
Skills Learned
- Audio frequency analysis.
- Band-pass filters.
- Active filter design.
- Signal rectification.
- Peak detection.
- LED level displays.
- ADC sampling.
- FFT analysis.
- Digital signal processing.
- Audio troubleshooting.
Key Points
- A spectrum analyzer separates an audio signal into frequency regions.
- Band-pass filters can be used to create an analog analyzer.
- Each frequency band requires level detection before display.
- LED bar graphs provide a simple visual representation.
- Digital analyzers can use FFT processing to obtain many frequency bands.
- Sampling rate determines the highest representable frequency.
- A buffer prevents excessive loading of the audio source.
- Input protection is important when connecting external audio equipment.
- A stereo analyzer can process left and right channels independently.