
Build a Transistor Curve Tracer
A transistor curve tracer is a useful electronic test instrument that shows how a semiconductor device behaves under different operating conditions. This project introduces controlled voltage and current sweeps, transistor characteristic curves, biasing, gain measurement and graphical analysis of electronic components.
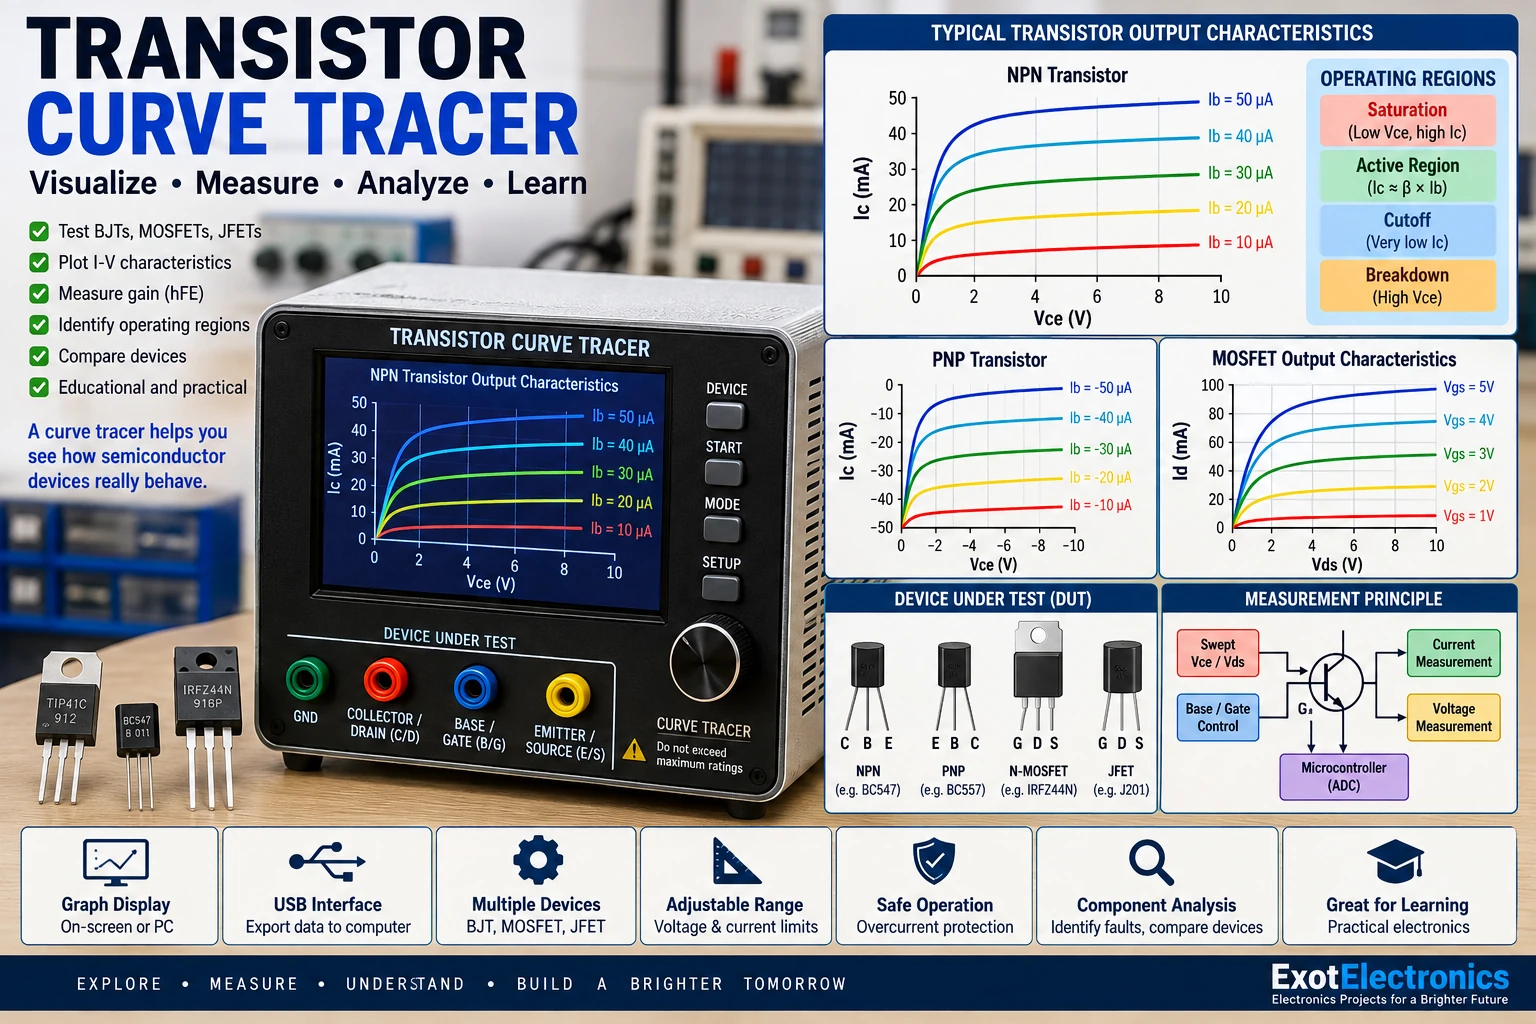
Project Overview
A curve tracer applies controlled electrical conditions to a device under test and measures the resulting electrical response.
        CONTROLLED SWEEP
               │
               ▼
        ┌─────────────┐
        │ Device Under│
        │    Test     │
        └─────────────┘
               │
               ▼
          Measurement
               │
               ▼
        Current / Voltage
               │
               ▼
          Graph Display
For a transistor, the resulting graph can reveal important operating characteristics that are difficult to understand from a single multimeter measurement.
What Is a Curve?
A characteristic curve is a graphical representation of the relationship between two or more electrical quantities.
For a bipolar transistor, a common characteristic is collector current plotted against collector-emitter voltage for several base currents.
Ic
│
│        ─────────
│      ───────────
│    ─────────────
│  ───────────────
│──────────────────────── Vce
Each curve corresponds to a different base-drive condition.
Why Build a Curve Tracer?
A curve tracer provides a visual way to study real components.
It can help identify:
- Transistor operating regions.
- Approximate current gain.
- Breakdown behavior.
- Saturation characteristics.
- Leakage current.
- Device-to-device differences.
- Faulty or damaged components.
Basic System
Microcontroller
      │
      ├────► Voltage Sweep
      │
      ├────► Base / Gate Control
      │
      ▼
Device Under Test
      │
      ├────► Voltage Measurement
      │
      └────► Current Measurement
                │
                ▼
          ADC Measurements
                │
                ▼
          Curve Calculation
                │
                ▼
             Display
Device Under Test
The device under test, or DUT, is the semiconductor component being measured.
A basic transistor curve tracer can be designed for:
- NPN transistors.
- PNP transistors.
- MOSFETs.
- JFETs.
- Other suitable semiconductor devices.
The test circuit must be changed appropriately for different device types.
NPN Transistor Test
For an NPN transistor, the collector-emitter voltage can be swept while the base current is changed in controlled steps.
        VCE
         │
         ▼
       Collector
          │
         ┌┴┐
Base ───►│Q│
         └┬┘
          │
        Emitter
          │
         GND
The collector current is measured for each voltage and base-current condition.
PNP Transistor Test
A PNP transistor can be tested using the corresponding reversed polarity arrangement.
The measurement software should understand the selected device type so that the displayed curves have the correct orientation.
Collector-Emitter Voltage Sweep
The controller gradually changes the collector-emitter voltage.
0 V
 │
 ▼
1 V
 │
 ▼
2 V
 │
 ▼
3 V
 │
 ▼
...
 │
 ▼
Maximum Test Voltage
At each step, the collector current is measured.
Base Current Steps
The base current can be changed in several controlled steps.
IB1
IB2
IB3
IB4
IB5
Each base-current value produces a different collector-current curve.
Transistor Characteristic Curves
The resulting graph can look conceptually like this:
Ic
│
│              ───────── IB5
│           ──────────── IB4
│        ─────────────── IB3
│     ───────────────── IB2
│  ──────────────────── IB1
│
└──────────────────────────── Vce
The curves show how collector current changes as collector-emitter voltage and base current vary.
Operating Regions
The transistor characteristic curve contains several important operating regions.
- Cutoff region.
- Active region.
- Saturation region.
- Breakdown region.
Cutoff Region
In cutoff, the transistor is receiving insufficient base drive for normal collector conduction.
Base Drive
    │
    ▼
Very Low
    │
    ▼
Collector Current
Very Low
This region corresponds approximately to the transistor being OFF.
Active Region
In the active region, collector current is largely controlled by the base current for a bipolar transistor.
This region is important in amplifier applications.
Ic ≈ β × Ib
The actual gain varies with transistor type, current, voltage and temperature.
Saturation Region
At low collector-emitter voltage, the transistor can enter saturation.
Increasing base drive further does not produce the same proportional increase in collector current.
This region is commonly used when a transistor is operating as a switch.
Breakdown Region
At sufficiently high collector-emitter voltage, a transistor can enter breakdown.
This region is generally outside the normal operating range and can damage the device if excessive current is allowed to flow.
A curve tracer must therefore limit the maximum test voltage and current.
Current Measurement
The collector current can be measured using a precision shunt resistor and an ADC.
Collector Current
       │
       ▼
   Shunt Resistor
       │
       ▼
Voltage Measurement
       │
       ▼
      ADC
       │
       ▼
Current Calculation
The current can be calculated from the measured voltage across the shunt.
I = Vshunt / Rshunt
Voltage Measurement
The device voltage can also be measured by the controller.
If the voltage is higher than the ADC input range, a resistor divider can scale it down.
Device Voltage
     │
     ▼
Resistor Divider
     │
     ▼
ADC
     │
     ▼
Calculated Voltage
The divider must be designed so that the ADC input never exceeds its permitted range.
ADC Resolution
ADC resolution affects the smallest voltage or current change that the instrument can distinguish.
Higher-resolution measurement can provide finer curves, but accuracy also depends on the reference voltage, analog circuitry, resistor tolerances and noise.
Constant-Current Base Drive
A controlled base-current source can provide more repeatable transistor curves.
Current Reference
       │
       ▼
Base Driver
       │
       ▼
Transistor Base
The base-current steps should remain sufficiently stable during the collector-voltage sweep.
Microcontroller Control
A microcontroller can coordinate the measurement sequence.
Select Base Current
        │
        ▼
Set VCE
        │
        ▼
Wait for Settling
        │
        ▼
Measure VCE
        │
        ▼
Measure IC
        │
        ▼
Store Point
        │
        ▼
Next VCE
        │
        ▼
Next Base Current
Measurement Settling Time
The circuit should be allowed to settle after changing the test conditions before the ADC measurements are taken.
If measurements are taken too quickly, switching transients can appear as incorrect points on the characteristic curve.
Data Storage
Each measured point can be stored as a pair of voltage and current values.
Vce     Ic
0.5 V   10 mA
1.0 V   25 mA
1.5 V   31 mA
2.0 V   33 mA
A complete curve consists of many such measurement points.
Graph Generation
The stored measurements can be converted into a graphical curve.
Measurements
     │
     ▼
Data Processing
     │
     ▼
Coordinate Conversion
     │
     ▼
Graph
The graph can be displayed on a small screen or transferred to a computer for more detailed analysis.
Computer Interface
A USB or serial connection can transfer measured data to a computer.
Curve Tracer
     │
     │ USB / Serial
     ▼
Computer
     │
     ▼
Graphing Software
This allows high-resolution graphs and storage of test results.
Transistor Gain
Approximate current gain can be estimated from collector and base current.
β ≈ Ic / Ib
The value is not necessarily constant over the complete operating range, so it should be treated as an operating-point measurement rather than a universal transistor constant.
Leakage Current
The curve tracer can also reveal small currents when the transistor is supposed to be in cutoff.
Unexpectedly high leakage can indicate a damaged device or unusual device characteristics.
MOSFET Curve Tracing
A similar instrument can measure MOSFET characteristics.
Instead of stepping base current, the gate-source voltage can be stepped through several values.
VGS1 VGS2 VGS3 VGS4 VGS5For each gate-voltage level, the drain current can be measured while the drain-source voltage is swept.
MOSFET Output Curves
Id │ │ ───────── VGS5 │ ───────────── VGS4 │ ───────────────── VGS3 │ ──────────────────── VGS2 │ ─────────────────────── VGS1 │ └──────────────────────────── VDS
These curves help visualize MOSFET operating regions and conduction behavior.
JFET Testing
JFET characteristics can also be examined by changing the gate-source voltage while measuring drain current.
The test circuitry must provide the appropriate polarity and voltage range for the device.
Current Limiting
Current limiting is one of the most important protection features of a curve tracer.
Test Current │ ▼ Compare With Limit │ ├── Below ──► Continue │ └── Above ──► Stop Sweep
The system should stop or reduce the test condition if the current exceeds the configured limit.
Voltage Limiting
The maximum test voltage should also be limited.
The controller should prevent the sweep from exceeding the safe operating range of the test circuit.
Power Limiting
The transistor can dissipate significant power during testing.
Power = VCE × IC
A device may be within its voltage and current limits while still exceeding its safe power dissipation.
The curve tracer should therefore consider voltage, current and power together.
Thermal Protection
Repeated or high-power measurements can heat the device under test.
A temperature sensor can be added near the DUT socket to monitor temperature.
DUT Temperature │ ▼ Temperature Limit │ ▼ Reduce / Stop Test
Test Pulse Operation
For devices that cannot safely dissipate continuous test power, the curve tracer can perform short measurement pulses.
Pulsed operation reduces average heating while still allowing the electrical characteristics to be measured.
Device Socket
A removable socket makes it easier to test different components.
The socket should clearly identify:
- Collector.
- Base.
- Emitter.
For MOSFETs, the corresponding gate, drain and source connections should be clearly marked.
Polarity Selection
The test system can provide separate modes for NPN and PNP devices.
The polarity of the test voltages and current measurements must match the selected device.
Automatic Device Test
A more advanced curve tracer can automate the complete measurement sequence.
Insert Device │ ▼ Select Device Type │ ▼ Run Safe Test │ ▼ Measure Curves │ ▼ Calculate Parameters │ ▼ Display Results
Comparing Transistors
Two or more devices can be tested using the same conditions.
Comparing their curves can reveal differences in:
- Current gain.
- Saturation behavior.
- Leakage.
- Breakdown characteristics.
- Conduction performance.
Matching Components
Curve tracing can help select devices with similar characteristics.
This can be useful when matching transistors for certain amplifier or analog-circuit applications.
The matching criteria should be selected according to the intended operating point.
Calibration
The measurement system should be calibrated before relying on its results.
Useful calibration checks include:
- Voltage measurement.
- Current measurement.
- ADC reference.
- Shunt resistance.
- Voltage-divider ratio.
Known reference components and precision measurement instruments can be used for verification.
Measurement Accuracy
Accuracy depends on the entire measurement chain.
- ADC accuracy.
- Reference voltage accuracy.
- Resistor tolerance.
- Shunt resistance tolerance.
- Amplifier offset.
- Electrical noise.
- Temperature drift.
- PCB layout.
Noise Reduction
Analog measurements can be affected by switching noise from the voltage sweep and digital electronics.
Good layout, filtering and appropriate grounding can improve the quality of the measured curves.
Protection Between DUT and Controller
The device under test should not be allowed to expose the microcontroller's ADC or GPIO pins to unsafe voltages.
Appropriate scaling, buffering and protection circuitry should be used between the DUT and controller.
Testing the Curve Tracer
- Inspect the PCB.
- Verify the power supply.
- Check voltage-scaling circuits.
- Check current-sensing circuits.
- Verify the ADC readings.
- Test the voltage sweep without a transistor.
- Verify current limiting.
- Test with a known low-power device.
- Compare the measured voltage with a multimeter.
- Compare the measured current with a reference meter.
- Verify the generated curve.
- Test the protection system.
Troubleshooting
Curve Is Noisy
- Check power-supply noise.
- Improve grounding.
- Add appropriate analog filtering.
- Increase measurement settling time.
- Keep switching signals away from analog inputs.
Current Reading Is Wrong
- Check the shunt resistor.
- Check the ADC reference.
- Check the current-sense amplifier.
- Verify calibration.
- Check PCB connections.
Voltage Reading Is Wrong
- Check the resistor divider.
- Check resistor values.
- Check ADC reference voltage.
- Check calibration.
Transistor Gets Hot
- Reduce test current.
- Reduce maximum test voltage.
- Reduce sweep duration.
- Use pulsed testing.
- Check the device power rating.
Curve Looks Incorrect
- Check transistor pin assignment.
- Check device polarity.
- Check base or gate drive.
- Check voltage and current scaling.
- Verify the measurement sequence.
Common Mistakes
- Ignoring transistor power dissipation.
- Exceeding the device voltage rating.
- Exceeding the device current rating.
- Using an inaccurate current shunt.
- Ignoring ADC reference errors.
- Testing a transistor with incorrect pin identification.
- Connecting the DUT directly to unprotected microcontroller inputs.
- Failing to provide current limiting.
- Ignoring thermal effects.
Applications
- Transistor testing.
- Component characterization.
- Semiconductor experiments.
- Amplifier design.
- Device matching.
- Repair and troubleshooting.
- Engineering education.
- Laboratory measurement.
Safety Notes
- Never exceed the voltage, current or power rating of the device under test.
- Use current limiting during every test.
- Provide appropriate protection for the measurement inputs.
- Allow adequate cooling for high-power tests.
- Use pulsed testing when continuous dissipation is unsafe.
- Verify semiconductor pinouts before inserting a device.
- Discharge capacitors before connecting a device to the tester.
- Disconnect power before servicing the test circuit.
Skills Learned
- Semiconductor characterization.
- Voltage measurement.
- Current measurement.
- ADC interfacing.
- Controlled voltage sweeps.
- Transistor biasing.
- Data acquisition.
- Graph generation.
- Current limiting.
- Electronic test equipment design.
Key Points
- A curve tracer graphically shows semiconductor operating characteristics.
- BJT curves can be generated by sweeping collector voltage at different base currents.
- MOSFET curves can be generated using different gate-source voltages.
- Voltage and current measurements must be accurately scaled for the ADC.
- Current, voltage and power limits are essential for protecting the DUT.
- Thermal effects can influence measurements.
- Calibration improves measurement reliability.
- Computer connectivity allows detailed graphing and data storage.
- Curve tracing can help compare, match and troubleshoot semiconductor devices.
- The instrument should always operate within the safe limits of both the DUT and the tester.