
Build a Digital Weather Station
A digital weather station measures environmental conditions such as temperature, humidity, atmospheric pressure and light level. A microcontroller collects the sensor data, processes the measurements and presents the information on a digital display. The system can also store measurements and transmit them over a network.
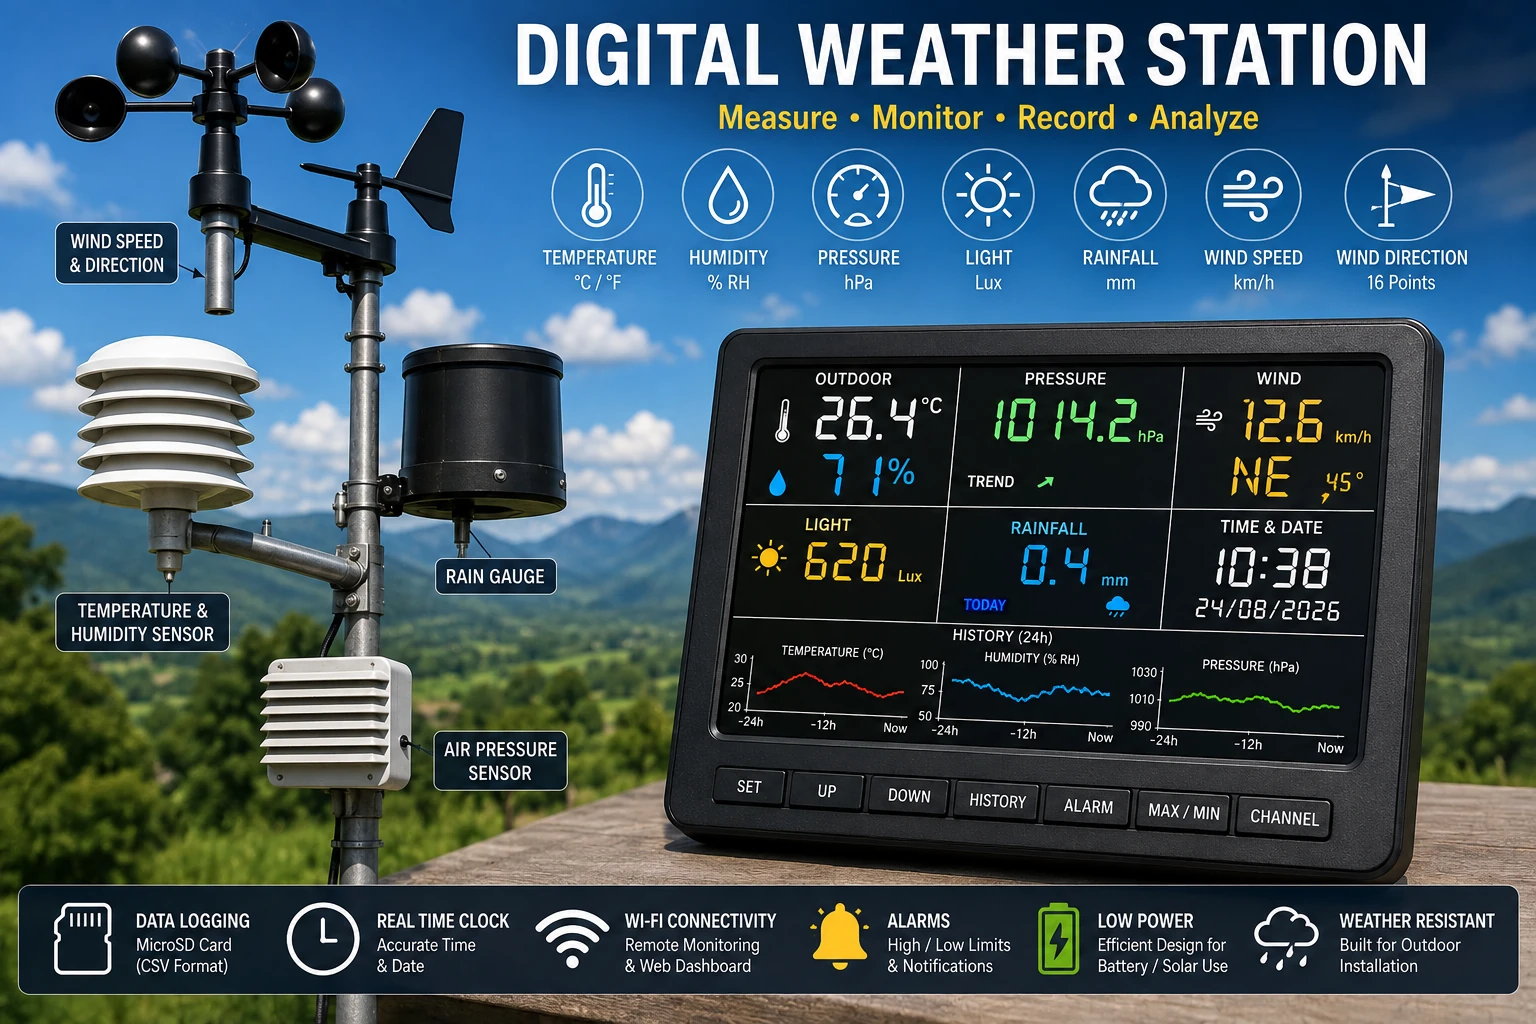
Project Overview
The weather station combines several environmental sensors with a microcontroller and display.
Temperature Sensor ───┐
Humidity Sensor ──────┤
Pressure Sensor ──────┤
Light Sensor ─────────┤
                      ▼
                Microcontroller
                      │
          ┌───────────┼───────────┐
          ▼           ▼           ▼
       Display      Storage      Wi-Fi
The controller periodically reads the sensors and converts their measurements into useful environmental information.
Environmental Measurements
A practical weather station can measure several parameters.
- Air temperature.
- Relative humidity.
- Atmospheric pressure.
- Light intensity.
- Rainfall.
- Wind speed.
- Wind direction.
The number of measurements depends on the sensors included in the design.
Temperature Measurement
Temperature is one of the most basic environmental measurements.
The sensor can be an analog device, thermistor or digital temperature sensor.
Temperature
     │
     ▼
Temperature Sensor
     │
     ▼
Microcontroller
     │
     ▼
Display
Temperature readings can be displayed in degrees Celsius or another supported unit.
Humidity Measurement
Relative humidity indicates how much water vapor is present in the air relative to the maximum amount the air can hold at that temperature.
A digital humidity sensor can provide both temperature and humidity measurements through a digital interface.
Humidity Sensor
      │
      ▼
Microcontroller
      │
      ▼
Humidity Display
Atmospheric Pressure
A barometric pressure sensor can measure atmospheric pressure.
Pressure information can be useful for observing changes in weather conditions and for estimating altitude.
Pressure Sensor
      │
      ▼
Microcontroller
      │
      ▼
Pressure Reading


The sensor should be installed according to its manufacturer's
recommendations and protected from direct exposure to water.
Light Measurement
A light sensor can measure the approximate brightness of the environment.
Possible sensors include:
- LDRs.
- Photodiodes.
- Phototransistors.
- Digital light sensors.
The measurement can be used to display daylight conditions or control other equipment.
Rain Detection
Rain can be detected using a rain sensor or, for more meaningful rainfall measurement, a tipping-bucket rain gauge.
A tipping-bucket sensor produces pulses as a known quantity of water fills and tips the measuring mechanism.
Rain │ ▼ Collector │ ▼ Tipping Bucket │ ▼ Magnetic / Reed Switch │ ▼ Microcontroller
The controller can count the pulses and convert them into rainfall measurements according to the gauge calibration.
Wind Speed
Wind speed can be measured using an anemometer.
Many simple anemometers produce electrical pulses as the cups rotate.
Wind │ ▼ Anemometer │ ▼ Pulse Signal │ ▼ Microcontroller │ ▼ Wind Speed
The controller measures the pulse frequency and converts it into wind speed using the sensor calibration.
Wind Direction
Wind direction can be measured using a vane connected to switches, resistors or an angle sensor.
The controller converts the sensor position into a direction such as:
N NE E SE S SW W NW
Higher-resolution sensors can provide more precise directional measurements.
Microcontroller
An ESP32, Arduino-compatible controller or another suitable microcontroller can process the sensor signals.
The controller can:
- Read environmental sensors.
- Calculate derived values.
- Update the display.
- Store measurements.
- Calculate minimum and maximum values.
- Provide alarms.
- Transmit data through Wi-Fi.
Digital Display
An LCD or OLED display can show the current environmental conditions.
┌────────────────────────────┐ │ WEATHER STATION │ │ │ │ TEMP 26.4 °C │ │ HUMIDITY 71 % │ │ PRESSURE 1014 hPa │ │ LIGHT 620 lx │ │ │ │ STATUS NORMAL │ └────────────────────────────┘
A larger display can show additional measurements such as wind speed and direction.
Display Pages
When the display is small, measurements can be divided into several pages.
Page 1 Temperature Humidity Page 2 Pressure Light Page 3 Wind Speed Wind Direction Page 4 Rainfall Min / Max
A button or rotary encoder can be used to move between pages.
Sensor Sampling
Different sensors do not necessarily need to be read at the same frequency.
For example, temperature and humidity can normally be sampled much more slowly than a wind-speed pulse signal.
Temperature ──► Slow Sampling Humidity ─────► Slow Sampling Pressure ─────► Periodic Sampling Wind Speed ───► Pulse Counting Rainfall ─────► Event Counting
Data Filtering
Sensor readings may contain noise or small fluctuations.
A moving average can make the displayed values more stable.
Average = (T1 + T2 + T3 + T4) / 4
Filtering should be selected carefully so that rapid environmental changes are not hidden.
Minimum and Maximum Values
The controller can keep track of the minimum and maximum values measured during a selected period.
Current Temperature 26.4 °C Minimum Temperature 21.7 °C Maximum Temperature 29.8 °C
The stored values can be reset manually or at a programmed interval.
Data Logging
A weather station becomes considerably more useful when measurements are stored over time.
Possible storage methods include:
- MicroSD card.
- Flash memory.
- External EEPROM.
- Cloud database.
- Local computer.
A typical record could contain a timestamp followed by the measured environmental values.
Time,Temperature,Humidity,Pressure 08:00,24.1,72,1015 09:00,24.8,70,1014 10:00,26.0,67,1013
Real-Time Clock
A real-time clock can provide accurate timestamps when measurements are stored locally.
The controller can use the time information to organize readings into daily and monthly records.
A battery-backed RTC can maintain time while the main system is powered off.
Wi-Fi Connectivity
An ESP32-based weather station can transmit measurements over Wi-Fi.
Sensors │ ▼ ESP32 │ │ Wi-Fi ▼ Router │ ▼ Computer / Phone / Server
This allows the measurements to be viewed remotely on a local network or sent to an appropriately secured data service.
Web Dashboard
A web interface can display current sensor readings and historical data.
┌─────────────────────────────────┐ │ WEATHER DASHBOARD │ ├─────────────────────────────────┤ │ Temperature 26.4 °C │ │ Humidity 71 % │ │ Pressure 1014 hPa │ │ Wind 12 km/h │ │ Direction NE │ │ Rain 0.4 mm │ └─────────────────────────────────┘
Graphs can be added to show how temperature, humidity and pressure change over time.
Weather Trends
Historical measurements can reveal environmental trends that are not obvious from a single reading.
For example, a graph can show:
- Temperature throughout the day.
- Humidity changes.
- Atmospheric pressure trends.
- Wind speed.
- Rainfall totals.
Pressure Trends
Changes in atmospheric pressure can be monitored over time.
Rather than relying on a single pressure reading, the station can display the direction and rate of pressure change.
Pressure 1020 ────────── 1018 ────────╲ 1016 ─────────╲ 1014 ──────────╲ Time ```Pressure trends can provide useful meteorological information, but they should not be treated as a guaranteed weather forecast.
Weather Alerts
The station can generate alerts when measurements exceed configured limits.
Examples include:
- High temperature.
- Low temperature.
- High humidity.
- Rapid pressure change.
- High wind speed.
- Rain detection.
Outdoor Sensor Enclosure
Outdoor sensors must be protected from rain and direct environmental exposure while still allowing accurate measurement.
The temperature and humidity sensor should have suitable ventilation and protection against direct water droplets.
A radiation shield can reduce the effect of direct sunlight on air temperature measurements.
Sensor Ventilation
A temperature or humidity sensor placed inside a completely sealed box can measure the enclosure temperature rather than the surrounding air.
The sensor housing should therefore provide controlled airflow while protecting the sensor from direct water exposure.
Power Supply
A weather station can operate from a mains adapter, battery or solar power system.
For outdoor installations, the power supply should be protected from moisture and environmental exposure.
A solar-powered station can use a rechargeable battery together with a solar charging system.
Low-Power Operation
A battery-powered weather station can reduce power consumption by placing the controller into sleep mode between measurements.
Wake │ ▼ Read Sensors │ ▼ Store / Transmit Data │ ▼ Sleep │ └──────────────► Repeat
The required sleep interval depends on how quickly the measured environmental conditions change and how frequently data must be available.
Solar-Powered Weather Station
A small solar panel can provide energy for a low-power outdoor weather station.
Solar Panel │ ▼ Charge Controller │ ▼ Battery │ ▼ Voltage Regulator │ ▼ Microcontroller │ ▼ Sensors
The power budget should account for sensor consumption, controller operation, wireless transmission and display usage.
Calibration
Sensors should be checked against appropriate reference instruments when accurate measurements are required.
Calibration may involve applying an offset:
Corrected Value = Measured Value + Offset
More advanced calibration can use multiple reference points.
Sensor Fault Detection
The controller should identify readings that are outside the valid range of a sensor.
Sensor Reading │ ▼ Valid? ┌────┴────┐ Yes No │ │ ▼ ▼ Display ERROR Value Status
This prevents a failed sensor from being interpreted as a real environmental measurement.
PCB Layout
Good PCB layout helps maintain reliable sensor measurements.
- Keep sensor signals away from noisy switching circuits.
- Provide local decoupling capacitors.
- Use appropriate grounding.
- Keep analog sensor wiring short where practical.
- Separate high-current power paths from sensitive measurements.
Testing the Weather Station
- Inspect the PCB.
- Verify the power supply.
- Check each sensor individually.
- Verify temperature readings.
- Verify humidity readings.
- Verify pressure readings.
- Test the display.
- Test data storage.
- Test Wi-Fi communication if fitted.
- Check timestamp accuracy.
- Test sensor-failure detection.
- Install the outdoor sensors only after bench testing is complete.
Troubleshooting
Temperature Reading Is Wrong
- Check sensor calibration.
- Check sensor placement.
- Check sensor wiring.
- Check the selected sensor type.
- Protect the sensor from direct sunlight.
Humidity Reading Is Wrong
- Check sensor ventilation.
- Check condensation or water exposure.
- Check sensor wiring.
- Check calibration.
- Replace a damaged sensor.
Pressure Reading Is Unstable
- Check the sensor supply.
- Check electrical noise.
- Check filtering.
- Check the sensor mounting.
Wi-Fi Disconnects
- Check signal strength.
- Check the power supply.
- Implement reconnection logic.
- Check the antenna.
- Check network configuration.
Data Logger Stops Recording
- Check storage media.
- Check available storage space.
- Check the file system.
- Check power interruptions.
- Check timestamp handling.
Common Mistakes
- Placing the temperature sensor in direct sunlight.
- Installing humidity sensors without adequate ventilation.
- Allowing water to enter the sensor enclosure.
- Ignoring sensor calibration.
- Using an unstable power supply.
- Failing to handle sensor errors.
- Ignoring Wi-Fi reconnection.
- Using excessive power on a battery-powered station.
- Placing sensors too close to heat-producing electronics.
Applications
- Home weather monitoring.
- Gardens and greenhouses.
- Workshops.
- Laboratories.
- Environmental monitoring.
- Solar installations.
- Remote monitoring stations.
- IoT development.
- Educational projects.
Safety Notes
- Protect outdoor electronics from rain and moisture.
- Use suitable weather-resistant enclosures.
- Use appropriately rated outdoor wiring.
- Protect the power supply against moisture.
- Do not expose low-voltage electronics to water.
- Use appropriate lightning and surge protection for exposed installations where required.
- Disconnect power before servicing the station.
Skills Learned
- Environmental sensing.
- Temperature measurement.
- Humidity measurement.
- Atmospheric pressure measurement.
- Sensor interfacing.
- Data logging.
- Real-time clock operation.
- Wi-Fi communication.
- Low-power operation.
- Outdoor sensor installation.
Key Points
- A weather station combines several environmental sensors.
- Temperature and humidity sensors require appropriate placement and ventilation.
- Atmospheric pressure can be logged to observe environmental trends.
- Wind and rainfall can be measured using pulse-generating sensors.
- A microcontroller can collect, process and display the measurements.
- Data logging allows historical environmental analysis.
- Wi-Fi can provide remote monitoring.
- Low-power techniques make battery and solar operation practical.
- Outdoor sensors require protection from weather without preventing proper measurement.
- Sensor calibration and fault detection improve measurement reliability.